OriginsInsight Edition 6

The 2013 Election 2013: Who Will Represent Multicultural Australia?

We have heard much in the election campaign of the past weeks and months about who is best placed to provide leadership in taking Australia forward.  Core issues have been defined as the economy, refugees, health, education, paid parental leave and the right to form a legal union with a partner of our choosing.

All of these policy areas have an impact across the spectrum of the Australian population, which, as confirmed by 2011 census data, reflects a range and depth of cultural diversity that is probably second only to the United States.

Diversity and inclusion are important themes for consideration in all aspects of policy and wider society.  If our political, business and community leaders are to be truly representative of the electorates, customers and members they serve, then, at the very least, we would expect them to reflect the demographics of those constituents.  Otherwise, we are saddled with paternalistic leadership and important voices are not heard.

Until recently, the diversity focus has been on gender, partly because it has displayed urgent and conspicuous gaps in opportunity and partly because it has been relatively easy to measure.

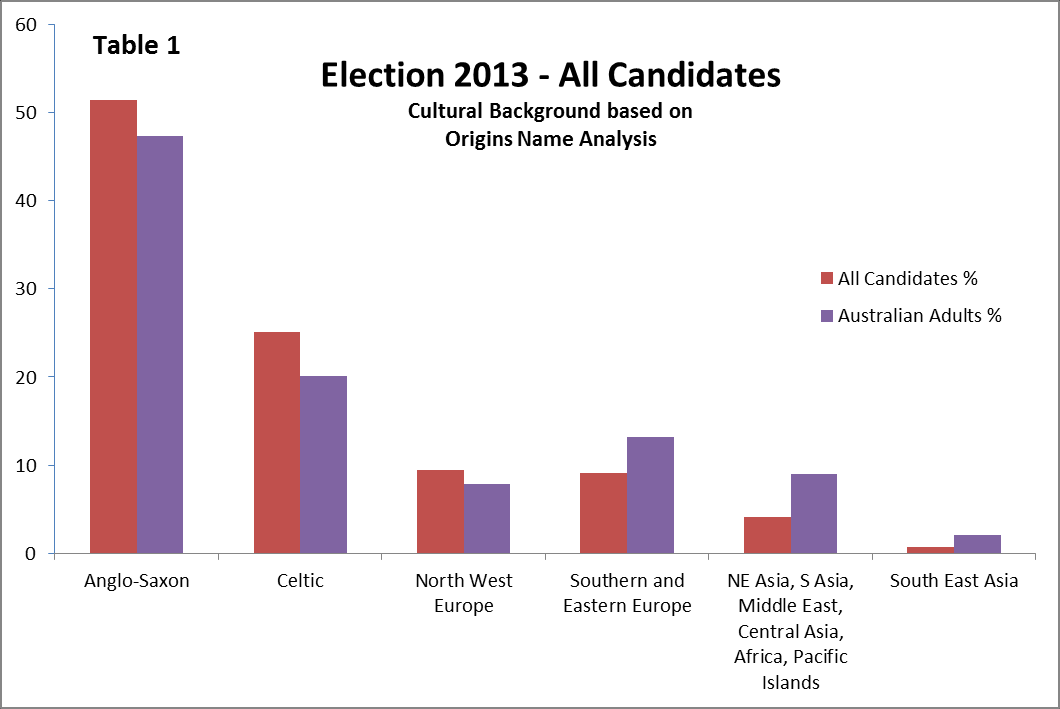
Now, attention is turning to the measurement of cultural diversity.  It has become an increasingly important reporting dimension of censuses from the past twenty years and, more recently, tools such as Origins have made it possible to measure diversity at the individual level.

In this special research report, we summarise the findings of how name analysis reveals insight into our prospective political representatives in the 2013 federal election.

Key questions

  • How well do the candidates for election reflect the multicultural population of Australia?
  • How well do candidates within the major states reflect State-based voters?
  • Are there any differences between candidates for the Senate and candidates for the House of Representatives?
  • Which party has the candidates that best reflect Australia’s cultural mix?

Methodology

OriginsInfo sourced a file from the Australian Electoral Commission indicating the personal and family names of the 1,717 candidates, the seat (or state) in which they were standing, and the party which they were representing.

We then coded the file with the Origins name analysis tool to evaluate the cultural origin of the name combination of each candidate. Using the OriginsInfo base file representing 14.4 million adults, similarly coded with one of the 257 Origins codes, we were then able to compare the cultural mix of candidates with the cultural mix of the Australian population, nationally and at state level.

The detailed 257-level of coding has been aggregated to reflect differences between the dominant population of Anglo-Saxon and Celtic origin, and the main geographic sources of predominantly post-WW2 migration from culturally and linguistically diverse (CALD) backgrounds.

We summarised CALD segments into four segments, and further aggregated them into ‘Broad CALD’, comprising all four segments, and ‘Narrow CALD’ comprising segments 2, 3 and 4, as shown below:

Post-WW2 Migration

Main Geographic Sources

Broad CALD Narrow CALD
1 North West Europe Y
2 Southern and Eastern Europe Y Y
3 NE Asia, S Asia, Middle East, Central Asia, Africa, Pacific Islands Y Y
4 South East Asia Y Y

Findings

The overall cultural mix of candidates points to a statistically significant under-representation of people from diverse cultural backgrounds.  Some 23.4% of candidates are from a Broad CALD background, compared with 31.1% of the Australian population.

Only 13.9% of candidates are from a generally more recent Narrow CALD background, although they make up 24.3% of the population.

Notably, members of the Afro-Arabic community are more representative of their community, including ten candidates with names originating from Lebanon.

Among the most over-represented are names reflecting a Celtic (predominantly Scottish and Irish) heritage.

At a more detailed level, and among those communities with sizeable numbers in the Australian population, there is marked under-representation of names indicating a heritage from Italy, Greece (especially from the mainland and islands other than Cyprus), Poland, Vietnam, China (Cantonese and Mandarin) and India.

State

Within the three major states, it is surprising that Queensland comes closest to reflecting its population composition.  With the smallest CALD population of the three large states, members of Queensland’s CALD communities are more likely to put themselves forward as candidates.  This is reflected in the comparably high index value of 85 for Broad CALD in Table 2.

Generalised Segment Index Values – Comparing % Candidates and % Population
National NSW VIC QLD
Anglo-Saxon 109 111 121 99
Celtic 125 137 128 118
North West Europe 121 133 93 108
Broad CALD 73 66 64 85
Narrow CALD 57 49 58 69

Interpretative Note:
Index = 100 where the % of candidates is identical to the % of population
Index = >100 where % of candidates exceeds % of population
Index = <100 where % of candidates is less than % of population

With only 13.6% of candidates classified as Narrow CALD, New South Wales offers the least cultural diversity of the three largest states despite having the second largest Narrow CALD population (27.6%) – giving an index value of 49. New South Wales has just three candidates of South Asian origin and six of East/South Asian origin.

On the other hand, it has a better representation of Islamic candidates, particularly among those with Afro-Arabic and Asian Islamic name origin. New South Wales also has the strongest representation of candidates with Celtic and North West European name origins, particularly those with Scottish, Irish and German names.

Victoria’s candidates are broadly similar to the national picture, apart from a relative under-representation from North West European background.  At a more detailed level, the low representation from Victoria’s sizeable Greek, South East Asian and East Asian communities is particularly notable.

Senate vs House of Representatives

Perhaps unsurprisingly, there is no significant difference between the Origins profile of the 529 Senate candidates compared with the 1,188 candidates for the House of Representatives.  Indicatively, however, there is a suggestion of under-representation among the Narrow CALD groups – 12.3% of Senate candidates vs 14.6% of lower house candidates.

Major Parties

Based on number of candidates, we defined the major parties as Liberal/National combined, Australian Greens, ALP, Palmer United Party (PUP) and Family First.  Table 3 summarises the broad cultural diversity profile for each of the major parties.

Candidates Cultural Diversity by Major Party %
1717 177 194 178 168 108 892
Generalised Segment AU Pop All Candidates ALP Lib/Nats Greens PUP Family First Other
Anglo-Saxon 47.3 51.4 48.6 48.5 57.3 43.5 60.2 51.9
Celtic 20.1 25.0 32.2 26.8 24.2 23.8 21.3 24.1
North West Europe 7.9 9.5 3.4 7.7 10.1 11.9 10.2 10.4
Broad CALD 32.1 23.4 19.2 24.7 18.5 32.7 18.5 23.8
Narrow CALD 24.3 13.9 15.8 17.0 8.4 20.8 8.3 13.3

Family First and the Greens are particularly distinctive in the lack of cultural diversity among their candidates.  For both parties, 81.5% of their candidates have either an Anglo-Saxon or Celtic name origin, compared with 67.4% of the Australian population.

Somewhat surprisingly, the ALP has the next least culturally diverse set of candidates among the major parties and has the lowest representation of names originating in North West Europe.  Their strong representation of Celtic names is interesting and deeper investigation reveals that 17.0% of candidates have a name of Irish origin, compared with 6.8% of the Australian population.

The most culturally diverse set of candidates is presented by the Palmer United Party.  Although still under-represented among the Narrow CALD communities compared with Australia as a whole, it is clearly out-performs the other major parties in attracting candidates from diverse backgrounds.  Half of the six Sikh candidates are aligned with the Palmer United Party.

Second behind Palmer United Party, the Liberal/National combined set of candidates also displays more cultural diversity than one might expect from the media presence of its leadership team.  Some 17% of its 194 candidates (33) are from a Narrow CALD background, including candidates whose names are of South Asian, Greek, Vietnamese and Islamic origin.

Conclusion

It is still less than forty years since the Whitlam government’s Racial Discrimination Act legislation effectively and finally ended the White Australia policy.  Compared with that time, the candidates presenting for the 2013 election reflect an unprecedented cultural diversity.  Out of 1,717 candidates, name analysis reveals that 239 (13.9%) are from communities whose principal period of migration has occurred since the end of the Second World War.But the evidence suggests there is still a long way to go before our potential political leaders reflect the diversity of contemporary multicultural Australia.

Back to OriginsInsight