Most analysts want to understand the integrity of their data resources. In this section, we share the work we have done to validate Origins as an appropriate measure of cultural diversity.
Validating Origins
Unlike clear-cut demographic markers such as age and (in most cases) gender, a precise definition of cultural background is elusive and multi-dimensional.
Several indicators of cultural background include demographic markers used by most census agencies. ‘Country of birth’ (self and parents), ‘language spoken at home’ and religion are among the most common. In the Australian census, there is also a question on ancestry. Each of these provides a different lens on Australia’s cultural diversity.
Analysis of name origins provides an additional lens. A substantial body of academic research has demonstrated that the analysis of names provides a robust and reliable surrogate for cultural background.
Here, we present four ways demonstrating the validity of using names:
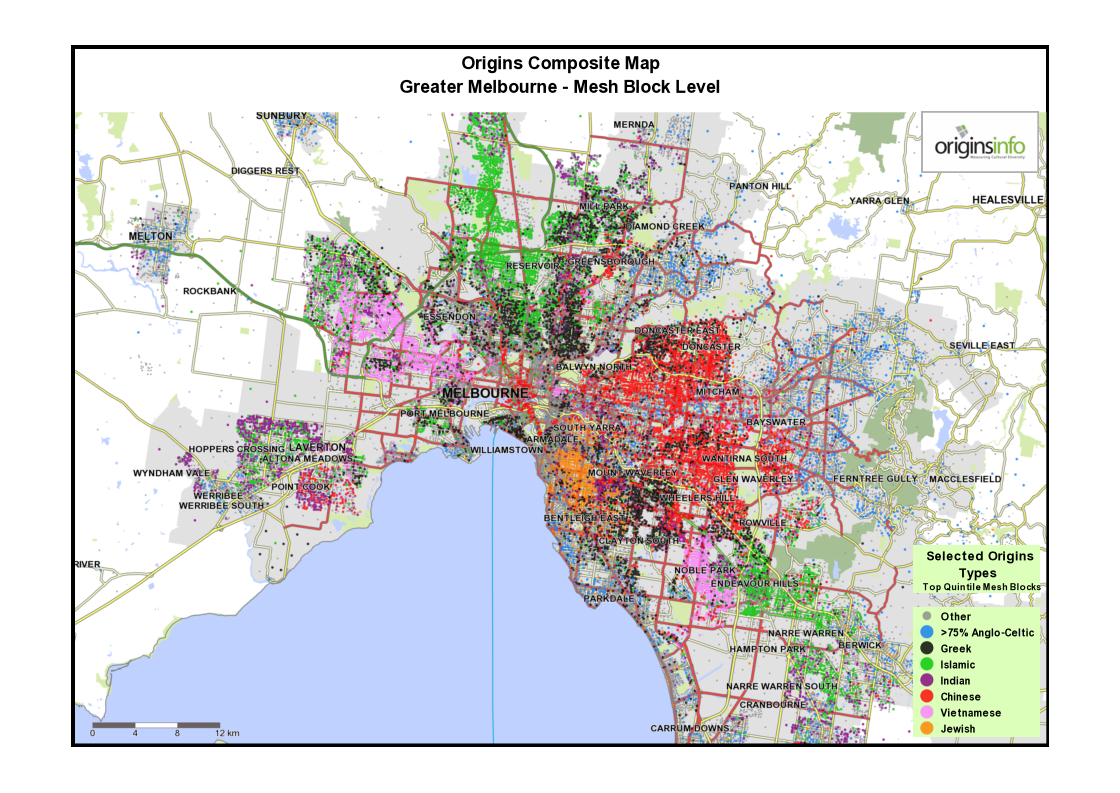
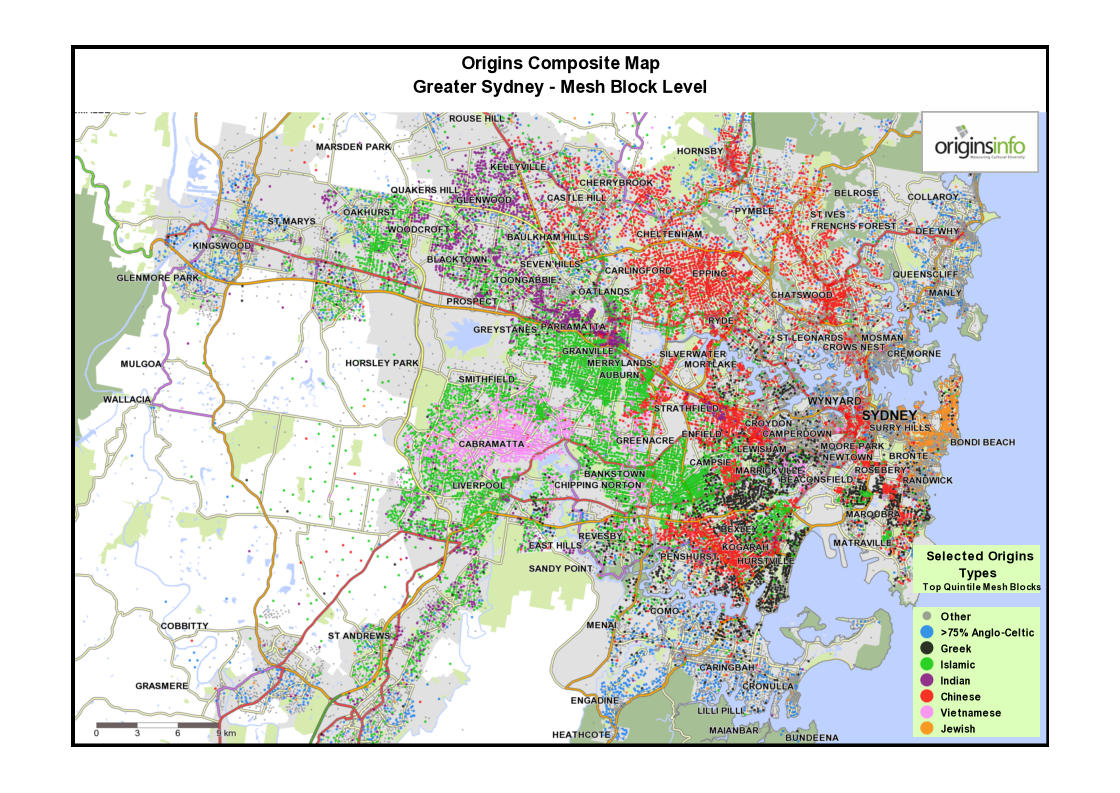
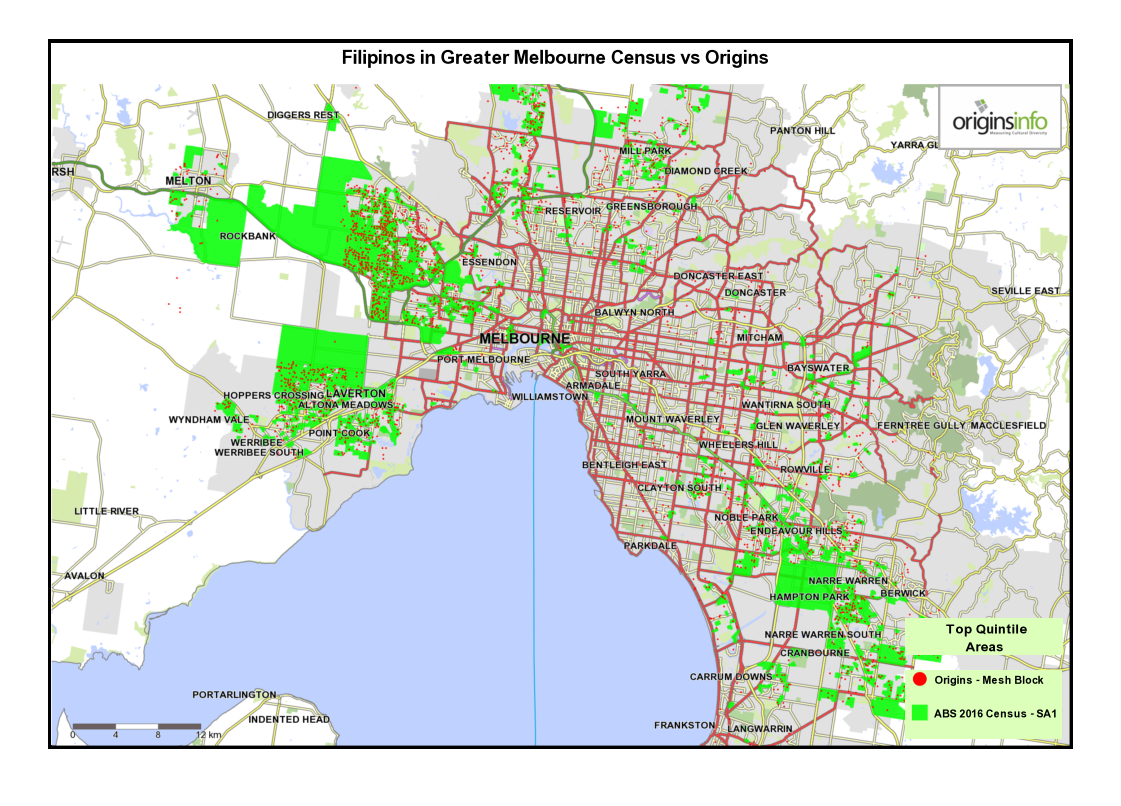
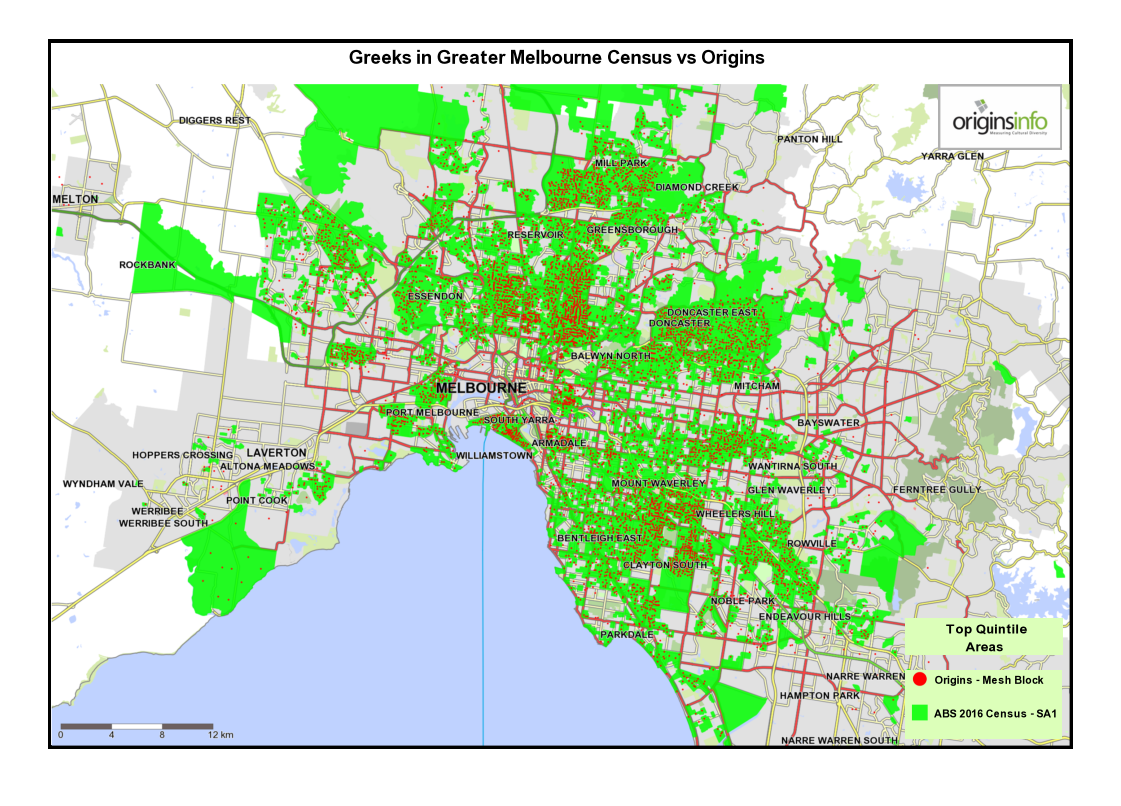
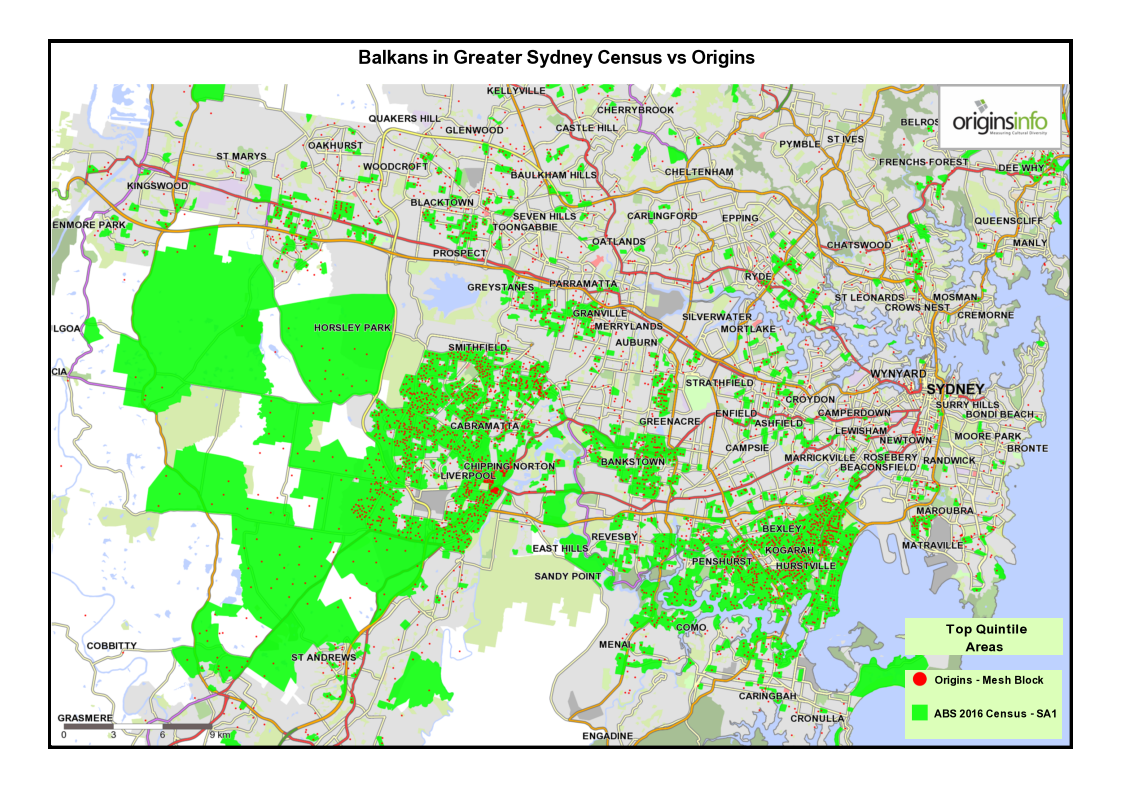
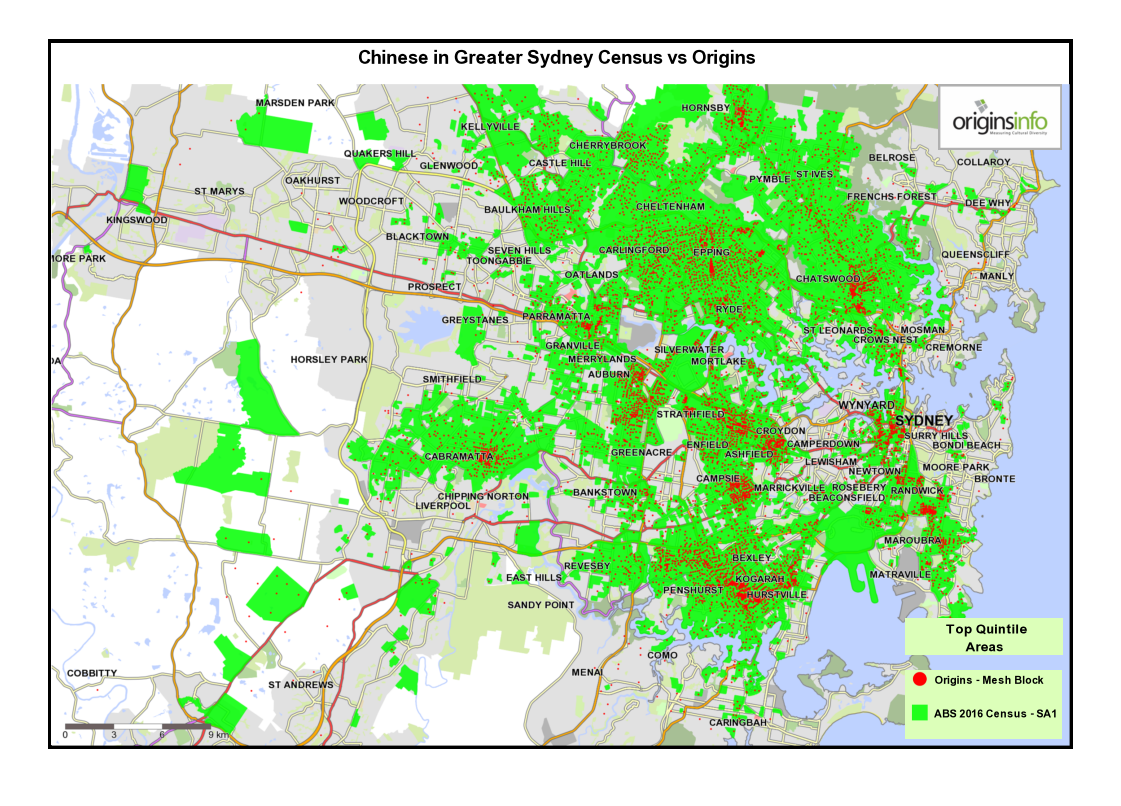
1 Composite maps for Sydney and Melbourne: Showing areas of greatest concentration of selected cultural groups
The purpose of these maps is to appeal to a viewer’s intuitive knowledge of where culturally-distinct communities may be found in Australia’s two largest cities. Data is sourced from the OriginsInfo Base file, representing more than 18m adults in Australia.
2 Table comparing Origins and Census data
The table shows the proportions within each Origins cultural segment from the OriginsInfo’s base file, representing more than 18m adults, and proportions from the 2016 census. The comparison is broadly similar, with expected minor variations, given that the two data sources are derived from two different methodologies.
Cultural Grouping | Origins: Adults; Personal & Family Names | 2016 Australian Census: Persons18+; Ancestry/Birth Country/Religion |
|---|---|---|
| Anglo-Celtic / Australian Anglo-Celtic | 67.34% | 65.71% |
| Greek / Greek Cypriot | 1.90% | 1.84% |
| Italian / Maltese | 4.72% | 5.05% |
| German | 3.77% | 4.90% |
| East / South East Asian | 6.62% | 8.41% |
| South Asian | 3.12% | 3.83% |
| Dutch / Afrikaner / Dutch S African | 1.70% | 1.40% |
| Polish | 1.04% | 0.87% |
| Balkan | 1.41% | 1.39% |
| Lebanese | 0.71% | 0.87% |
| Turkish | 0.41% | 0.31% |
| Filipino | 0.84% | 1.10% |
| Islamic | 2.96% | 2.20% |
| Jewish | 0.33% | 0.39% |
| Sikh | 0.44% | 0.53% |
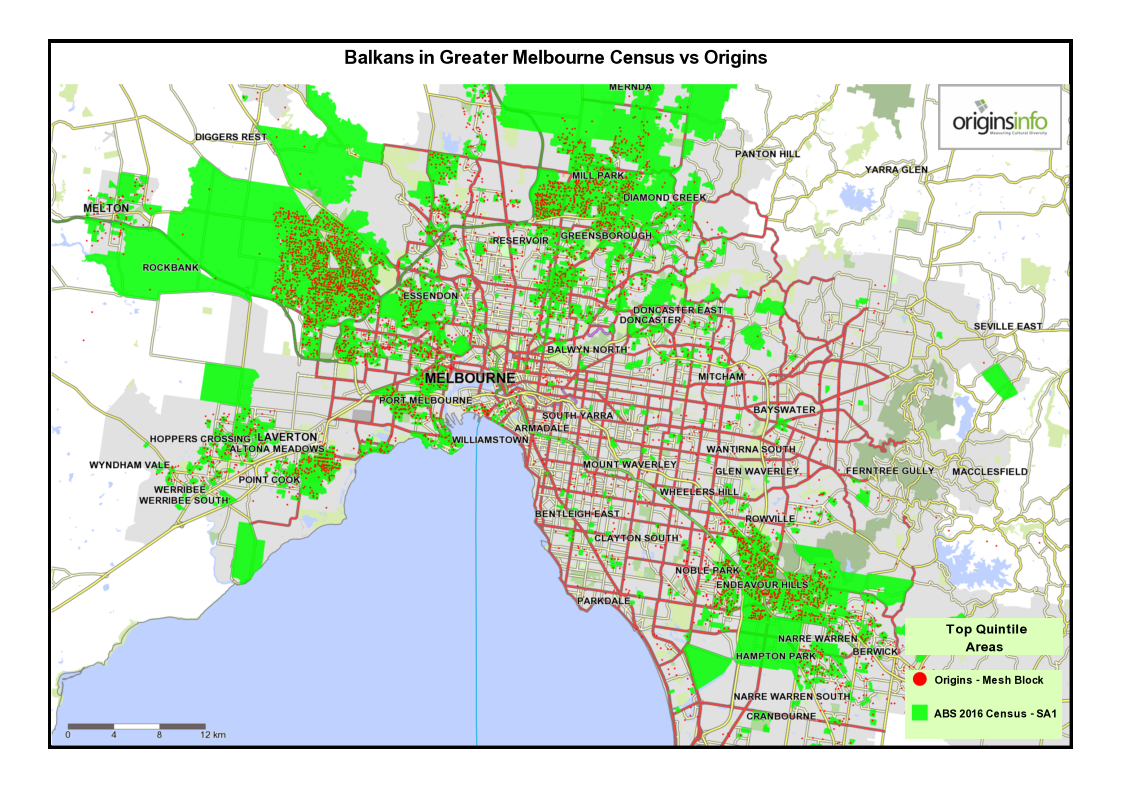
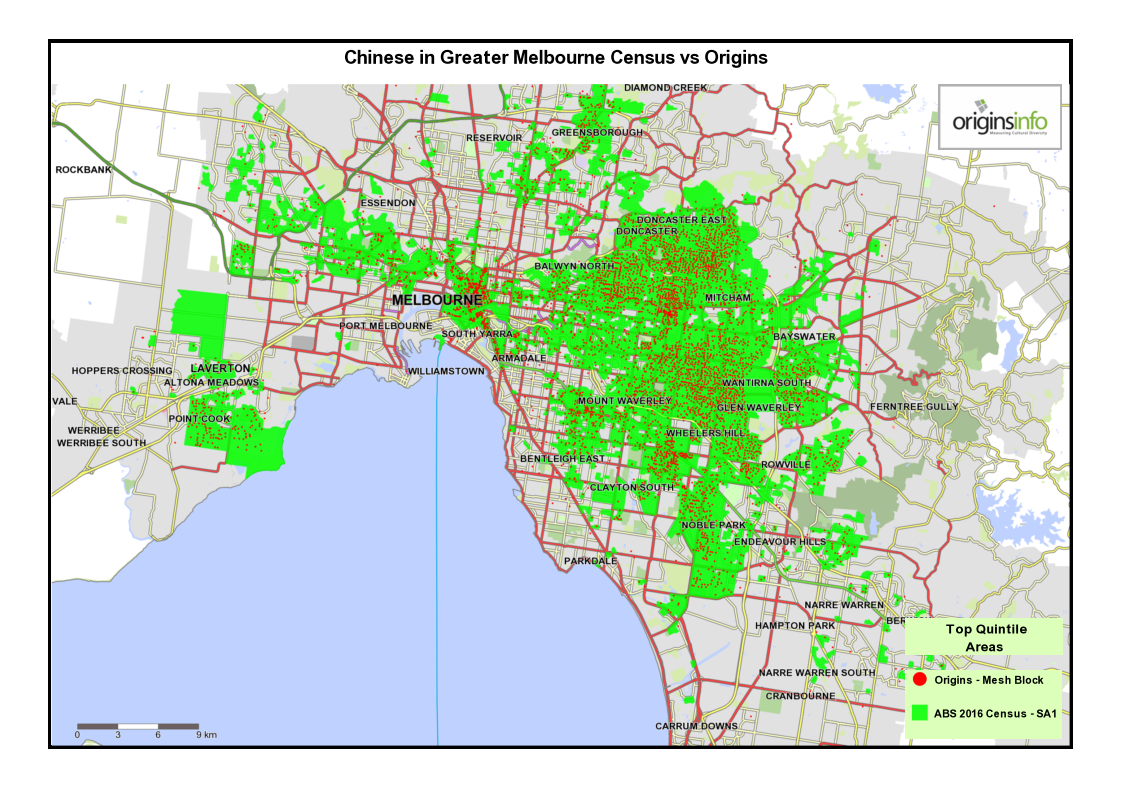
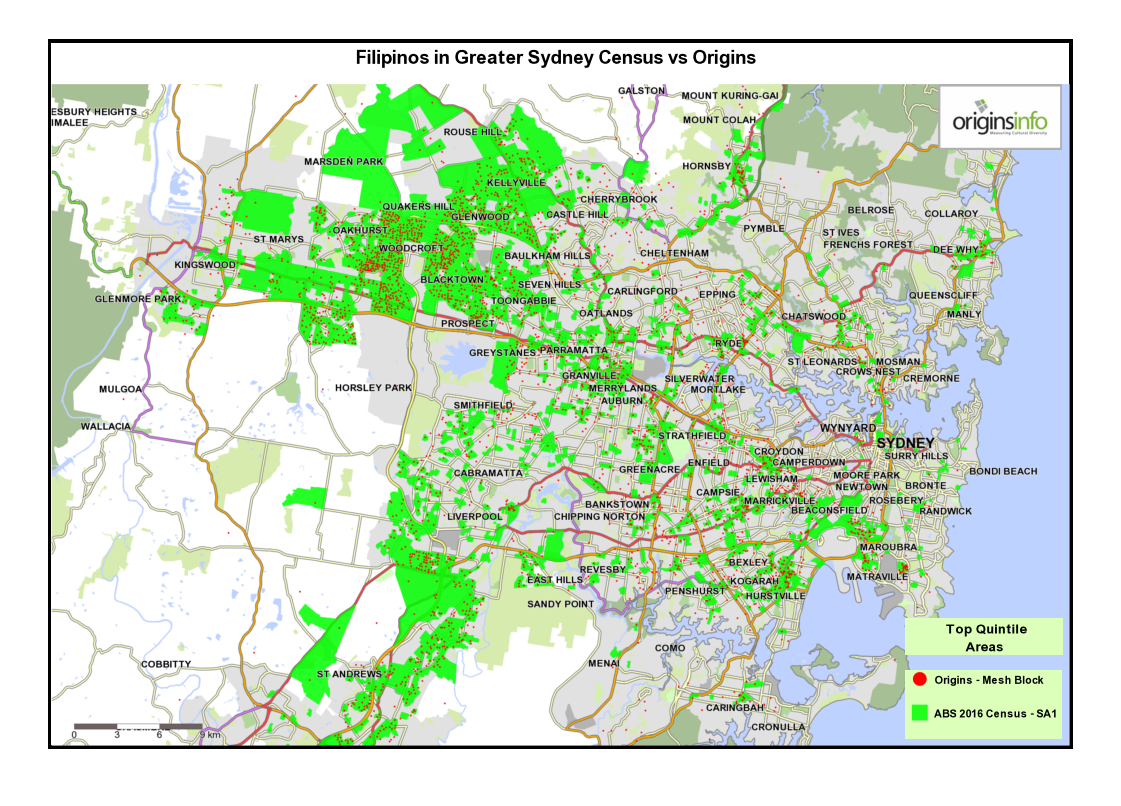
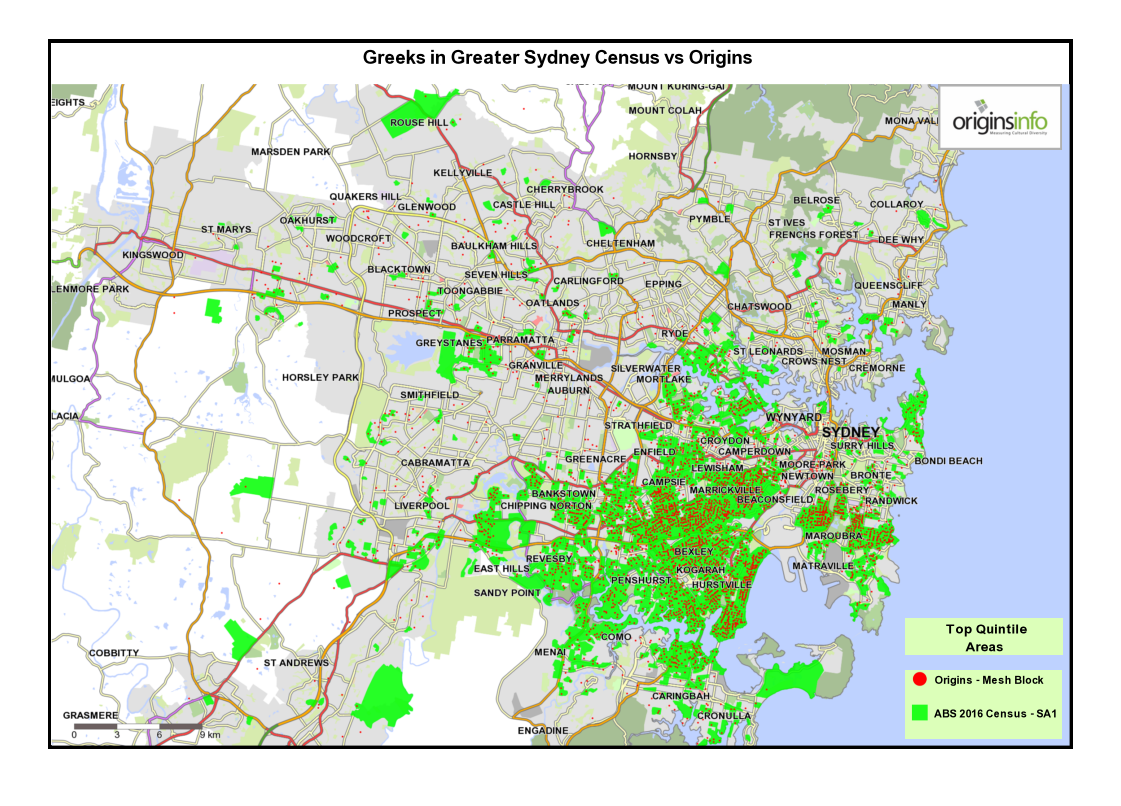
3 Comparing top-quintile areas for Origins with ABS 2016 Census data – Melbourne and Sydney.
These maps show top-quintile top-quintile Origins Types, mapped at Mesh Block level, compared with SA1 census areas for each cultural community defined by the 2016 census.
Both SA1 and Mesh Block are spatial units in the Australian Statistical Geography Standard. The SA1 area averages around 180 households while, Mesh Blocks, being more granular, contain an average of around 45 households.
Notice that the two data sources – Origins and census – are generally telling the same story. Minor variations are as expected, given that both data sources use different methodologies.
Also, because Origins data is mapped at a more granular level, small ‘outliers’ of concentration are identified that are missed at the SA1 level because localised Mesh Block ‘peaks’ are smoothed at SA1 level.
4 Comparing Origins estimates with known cultural indicators.
Four pieces of validation work have been conducted where a comparison has been made between the Origins coding and client database information recorded on ‘cultural background’. It is rare for organisations to record cultural indicators in substantial quantities.
In assessing the outcomes, remember that we are comparing different definitions of cultural background. Among the variances, it is equally likely that either definition may be more ‘correct’.
Summarised information on these four cases follows:
Case 1: Government Department – Health 1
This department recorded ‘Country of Birth’ for 364,714 persons. Using Origins codes, 88.34% of records were matched to the correct Origins Group. The “Origins Group” is a 16-category classification and is therefore slightly less granular the Origins Type used in our claim for accuracy (see Accuracy section of Coverage, Accuracy & Privacy). The 25-category Origins Type classification was introduced after this test was conducted.
Discounting for the difference in granularity of Type vs Group, we could expect an overall hit rate of around 85%.
Case 2: Australian Football League – Elite players
Over the past few years, the AFL has collected ‘country of origin’ – or a similar cultural indicator – for a proportion of its elite players who were not of Anglo-Celtic heritage.
Of the 383 players with names that were not of Australian/Anglo-Celtic background, Origins successfully assigned 335 (87.5%) to the correct Origins Type.
At the time of this analysis, the census ratio between Australian/Anglo-Celtic country of birth to non-Anglo-Celtic country of birth was 72:28.
By extrapolating the AFL findings, we could expect the following to reflect a random sample of the Australian population:
- Based on Origins extensive data coverage and regular testing, we can confidently claim 95% accuracy for Anglo-Celtic names. Using the Australian Anglo-Celtic census proportion of 72%, we can reasonably expect to achieve 68.5 percentage points of accuracy from this subset (95% * 72%).
- For non-Anglo-Celtic names, using the success rate of 87.5% that we achieved with non-Anglo-Celtic AFL players, we can reasonably expect to achieve an additional 24.5 percentage points of accuracy from this subset (87.5% * 28%).
By adding Anglo-Celtic and non-Anglo-Celtic together produces an estimated accuracy level of 93% (68.5 + 24.5).
Case 3: Government Department – Community Services
A government department employs some members of staff who have a non-Anglo-Celtic background. Their role is to offer translation and engagement services for their clients. A small list of staff was supplied to OriginsInfo and this was coded with the Origins software.
Of the 45 staff members where language was known, 26 (57.8%) were correctly coded to their Origins Type. Remember that these are of non-Anglo-Celtic background and were therefore only representative of the (then) 28% of the Australian population with a non-Anglo-Celtic heritage.
As with Case 2, assuming a 95% hit rate for Anglo-Celtic group, we could therefore estimate an overall hit rate of (95% * 72%) + (57.8% * 28%) = (68.5% + 16.18%) = 84.68%.
Case 4: Government Department – Health 2
This case related to a satisfaction survey where the department offered a paper-based survey in a range of community languages. The vast majority chose English as their preferred language for the survey, irrespective of their cultural background.
However, of those indicating a preference for the survey to be provided in a language other than English, 601 of 748 patients (80.3%) were correctly predicted by the Origins language indicator. The Origins language indicator is a derivative from the 260 Origins CEL codes, forming a classification of 108 languages.
When the language indicator is aggregated to its Origins Type, the success rate rises to 85.4%, given the lower granularity of Origins Type.
Based on these four studies, we think it is reasonable to set an accuracy expectation of around 85% when Origins is used to code any random sample of the Australian population. This claim applies at the 25-category Origins Type level of classification.