Spotlight On … The Chinese Community At Chinese New Year
Overview
Chinese New Year is the most important event on the Chinese calendar. This New Year, which falls on the 23rd January, is particularly auspicious being the Year of the Dragon. Those born in Dragon years are viewed to have good fortune and great power and it is seen as one of the most positive and strongest of the 12 signs. Dragon years are the most popular to have babies.
In this paper, we share some knowledge of the customs and traditions, look at the market characteristics drawing on data from the 2006 census and the 2011 Origins database, and highlight some key considerations for successful engagement with the Chinese consumer.
Customs and Traditions
Chinese New Year customs and traditions stem from the legendary tale of Nian, a mythical monster with a head like a lion and body like an elephant. According to legend, Nian would come down the mountain on the first day of the New Year to the villages below and eat livestock, crop and even villagers. To protect themselves, at the beginning of new year villagers would leave food outside their door for Nian in the hope it would not eat any more people. One day the villagers saw Nian was scared by a little boy wearing red. From then on they hung red lanterns and scrolls from doors and windows. They also believed Nian was afraid of noise, and used firecrackers to ward it off.
Chinese New Year festivities last for 15 days, with special customs, traditions and events for each day. Everything that happens during these festivities is designed to bring good fortune. Festivities commence on New Year’s Eve with several traditions. Houses will be thoroughly cleaned to sweep away any misfortunes and prepare the way for incoming good fortune. Decorations including auspicious messages written on red paper will be hung around houses. On New Year’s Eve families share a huge feast and at midnight, the New Year is ushered in with firecrackers.
On the day of the New Year, it is customary for children and young people to be given red envelopes containing money. In addition, small gifts such as food and sweets are exchanged between friends and relatives. Visits are made to homes of elderly relatives where small gifts are exchanged.
Often people will wear entirely new clothes on New Year’s Day, mostly in the colour red, to signify a fresh start to the year, and to honour the tradition of the colour red scaring away evil spirits. Red is an auspicious colour in Chinese tradition, signifying joy, virtue and prosperity.
New Year celebrations end on the 15th day with a lantern ceremony, where people hang decorated lanterns in temples and carry lanterns to an evening parade. Often the dragon dance is a feature of the evening parade.
The Chinese Community in Australia: Market Characteristics
During Australia’s early establishment, Chinese immigrants were the dominant non-European immigrant group. Large numbers of Chinese arrived for the gold rushes from the 1850s onwards, and by the time of Australia’s Federation in 1901, Chinese people numbered 29,000, representing almost 1% of the population.1
Today, the Chinese community in Australia comprises 3.4% of the total population. OriginsInfo estimates there are more than 675,000 people in Australia with Chinese ancestry.2 Migrants from China (including Hong Kong) comprise the largest immigrant group after those from the UK and New Zealand. The majority of Australians with Chinese origin are found in New South Wales and Victoria – 46% and 30% respectively, with the overwhelming majority living in Sydney and Melbourne.
As trade relations between Australia and China continue to grow and increase in importance, it is anticipated that the Chinese community in Australia will continue to grow.
| Australians of Chinese Origin by State/Territory | ||||||||||
| State | NSW | VIC | SA | WA | QLD | ACT | TAS | NT | Not Stated | TOTAL |
| Chinese Origin |
176,024 | 112,634 | 17,997 | 25,786 | 41,639 | 5,808 | 2,601 | 1,571 | 514 | 675,636 |
| Australian Population3 |
6.55m | 4.93m | 1.51m | 1.96m | 3.90m | 0.32m | 0.48m | 0.19m | 0.00m | 19.86m |
| Chinese Proportion |
4.74% | 3.88% | 1.68% | 2.86% | 1.88% | 3.14% | 0.84% | 2.13% | 22.16% | 3.4% |
| Source: Data generated using ABS TableBuilder: 2006 Census of Population and Housing | ||||||||||
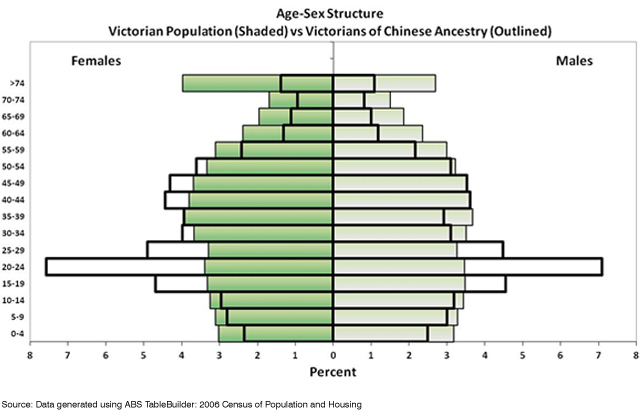
The following age-sex pyramids highlight the distinctive population structure of the Chinese community. Across Australia, Chinese are much younger and, unusually, females markedly outnumber males in every age category except the under 15s when compared to the total Australian population. These trends are particularly obvious in Victoria where the population is even younger and features a high female:male ratio.
The Victoria chart shows that more than 17% of Chinese people are aged 15 to 29, compared with around 9% for the Victorian population as a whole. In the 30-39 age groups in Victoria there are 31.5% more Chinese females than males! This gender skew reflects a considerable bias in the migrant stream, suggesting that Australia offers females greater opportunity than in China, despite its own recent history of spectacular growth.
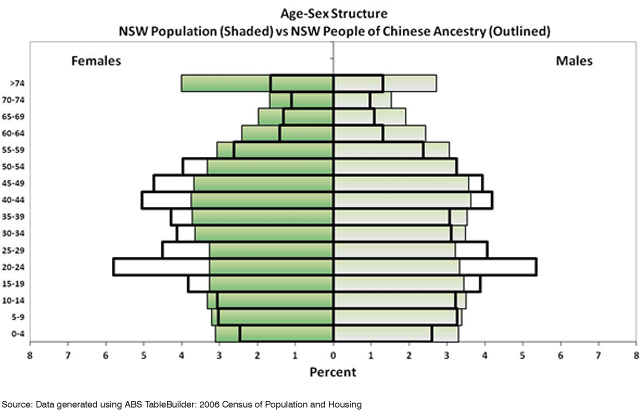
The NSW chart is similar to that of Victoria but somewhat less spectacular, showing a greater resemblance to the overall pattern for Australia (chart not included).
The age profile of the Chinese profile is partly explained by the number of migrants who move to Australia to complete their tertiary education. Given the continuing high value placed on education by the more established members of the Chinese community, it is perhaps not surprising that many Chinese – almost a third of the population – are engaged in full-time study.
| Student Status: Australians of Chinese Origin vs Total Population | |||
| Student status | Australia: Chinese origin | Australia: Population | Index |
| Full-time Student | 32.03% | 19.46% | 165 |
| Source: Data generated using ABS TableBuilder: 2006 Census of Population and Housing | |||
Reflecting the age profile and the higher than average proportion engaged in tertiary education it is not surprising that achievement levels in education among the Chinese in Australia are very high. More than twice the proportion of Chinese people hold a Degree or higher compared with the Australian population. For Postgraduate degrees, the comparison is over three times the proportion of the population as a whole.
| Education Levels: Australians of Chinese Origin vs Total Population | |||
| Highest Level of Education | Australia:Chinese origin | Australia:Population | Index |
| Postgraduate Degree Level | 6.3% 42,664 |
2.1% 413,095 |
304 |
| Graduate Diploma and Graduate Certificate Level | 1.2% 7,779 |
1.2% 228,556 |
100 |
| Bachelor Degree Level | 20.0% 133,086 |
9.3% 1,840,661 |
212 |
| Total with Degree or Higher | 27.2% 183,526 |
12.5% 2,482,312 |
217 |
| Source: Data generated using ABS TableBuilder: 2006 Census of Population and Housing | |||
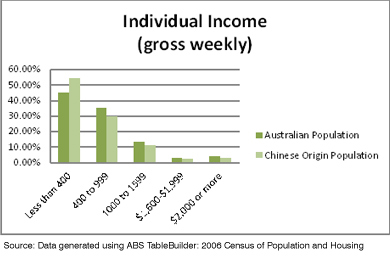
Income levels among Australians of Chinese Origin are lower compared with the total Australian population, with well over half of the Chinese population earning $400 or less per week. This pattern reflects the large number of young Chinese students and people in the early stages of their career.
In reviewing Age-Sex structure, student status, education levels and income levels it is clear that a large number of this young population has some way to go to reach its earning potential. The population is highly educated and represents a great opportunity for marketers to project their brands and engage effectively.
The Origins View of the Chinese Community
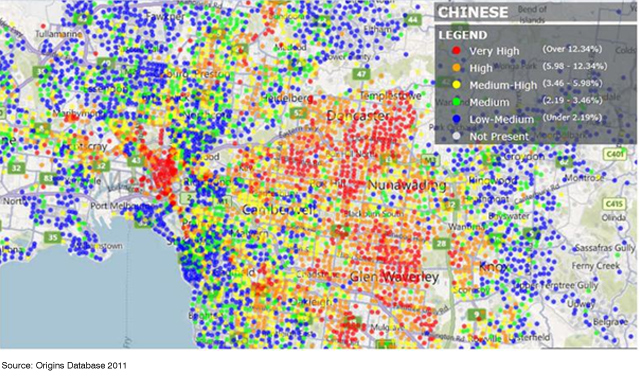
OriginsInfo’s robust name analysis database provides very accurate and detailed information about geographical concentrations of particular cultural communities. When we analyse the Chinese community in Melbourne and Sydney which have the largest populations of people of Chinese origin, we can see distinct patterns of distribution.
When we map Melbourne at Statistical Area 1 (SA1 level) we can see clusters of Chinese Australians in certain suburbs, in particular around Kew, Box Hill, Templestowe, Mount Waverley, Glen Waverley and the CBD. These locations reflect the preference for high density CBD apartment living for non-family younger Chinese and a range of inner/middle eastern suburbs for those of family status.
Local Government Areas (LGAs) containing the highest number of people of Chinese origin are shown below for each of the main Australian States.
| Top 5 LGAs by Count | |||||||||
| NSW |
VIC | QLD | SA | WA | |||||
| Hurstville | 11,655 | Monash | 14,351 | Brisbane | 26,046 | Port Adelaide/ Enfield |
1,995 | Canning | 4,615 |
| Sydney | 10,747 | Whitehorse | 11,180 | Gold Coast | 4,654 | West Torrens | 1,661 | Stirling | 2,833 |
| Ryde | 10,234 | Manningham | 9,514 | Logan | 2,051 | Burnside | 1,618 | Melville | 2,709 |
| Canterbury | 9,963 | Boroondara | 8,916 | Cairns | 1,146 | Adelaide | 1,364 | Gosnells | 1,841 |
| Parramatta | 9,780 | Melbourne | 8,749 | Moreton Bay | 1,033 | Salisbury | 1,284 | Bayswater | 1,290 |
| Source: Origins Database 2011 | |||||||||
When calculated as a proportion of population, a different picture emerges with Burwood, Auburn and Strathfield standing out in New South Wales, City of Melbourne in Victoria, and City of Perth in WA.
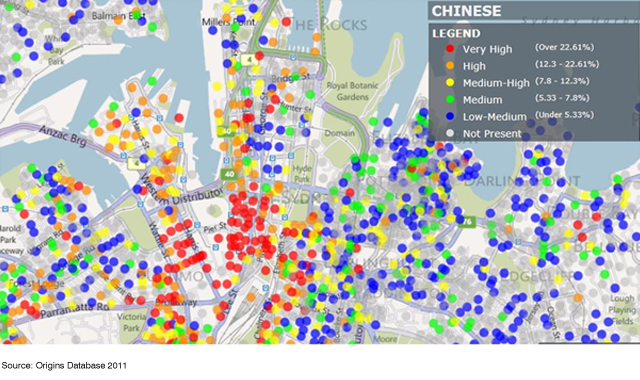
The Origins database hones in on particular cultural clusters right down to street level. The following map of inner Sydney has been mapped at the new Mesh Block level and highlights pockets of Chinese concentration to the South of the CBD and around Ultimo. More than one in four of the population in many of these blocks are of Chinese origin.
Chinese Consumer Attitudes
Although competence in the use of English is very high, around 75% of Chinese people speak a Chinese language at home.4 Reflecting this, Chinese are regular consumers of in-language media. The four Chinese newspapers in Sydney outnumber their English equivalents and reach almost two-thirds of the Chinese population. In-language television reaches 28% of the Mandarin population and 40% of Cantonese speakers. In-language radio reaches about a quarter of Cantonese speakers in Sydney, although this is less popular with Mandarin speakers.5
Advertising design and copy often make extensive use of red and orange – colours that symbolise prosperity – especially around Chinese New Year. The numbers 8, 2 and 6 symbolise good luck while the number 4 is least favoured, often symbolising death. As described earlier, China’s long history is full of tradition, symbolism and culture and marketing messages must appeal to the national character of mutual respect and loyalty.
The rise of China and its global influence is a great source of pride for Chinese people in Australia. Marketers should recognise and celebrate Chinese success and culture to maximise the effectiveness of brand engagement.6
Independence and self-sufficiency are important to Chinese people; they are debt-averse and provision will usually be made for savings, investment and private health insurance.
The importance of ‘face’ means that Chinese people are often showy in public but are very careful in private. They are large consumers of luxury goods such as watches, jewellery, apparel, fragrance and luggage. They are early adopters of technology and are most likely to buy new cars.
Asians, as a whole, index high for FMCG consumption in categories such as soap, baby products, oral care, analgesics, soft drinks and bottled water. On the other hand, Chinese people are reluctant to spend on interior decorations and furnishings because only the family will notice these things.
Purchase decisions are strongly influenced by recommendations from family and friends, although impulse purchasing is common as a result of in-store promotions, spotting a great deal, and engagement with effective salespeople.
In matters of health, people of Chinese heritage are more susceptible to Hepatitis C and respond well to messages that use fear or scare tactics in matters of health promotion. Chinese people generally like to pre-plan their funeral and prefer a separate Chinese area in cemeteries.
Chinese people are frequent travellers, often to China, making themselves very susceptible to airline and travel goods promotions. Asians in general are the most ‘mature’ users of the web; they spend more time online and are the most frequent product researchers and transactors. Similarly, the Chinese are high value consumers of international calling.7
Confucius spoke 2000 years ago about “ren” – benevolence – this promotes the value of looking after others and helping in times of need. This certainly applies to family and friends. However, giving money and volunteering time to wider community causes is less common, with China ranking 147 in a recent survey.8
1 https://en.wikipedia.org/wiki/Chinese_Australians
2 Data Source: 2006 Census of Population and Housing
3 According to the 2006 ABS Census data
4 ABS 2006 Census
5 Cultural Partners, Newspoll 2008
6 See Jerry Clode, How to Engage with Chinese Consumers: With Partnership and Respect, 25 March 2011
7 Preceding paragraphs draw from various sources including The Economist, 7 July 2011 – The Mystery of the Chinese Consumer; Burgos and Mobulade, Marketing to the New Majority; Jessie Wong, Multicultural Marketing and Management; Gitlin, The Sourcebook of Multicultural Experts, 2010/11
8 Guardian Weekly, 17 October 2010 reporting on a Gallup survey